Now you can get the training you need to deploy a successful CRM strategy – any place, anytime

At Axis Global Partners, we make increasing our client’s CRM implementation success rates a priority. We understand that to accomplish this goal, we need to bridge the gap between technology and our client’s knowledge and readiness to deploy their solution.

In this connection, we are proud to announce a professional online certificate program designed by the College of Business Administration at Florida International University (FIU) and Dr. Nancy Rauseo. This program combines real world expertise from CRM professionals and academic excellence from an accredited (AACSB) public research university.

This CRM Online Professional Certificate Program, gives you access to the latest and most proven CRM methodologies, concepts, tools, and practices. And best of all, you can start deploying them while you are in training!

Throughout the program, you will have ongoing online interactions with well-known CRM and marketing faculty and experts from Florida International University (FIU). Our lead facilitator has held senior executive positions in corporations, implementing CRM initiatives from strategy, people, process, and technology perspectives. This faculty will serve as your CRM consultants, helping you implement your own CRM initiatives. You also will have the opportunity to interact online with other program participants through online discussion forums and real-time chat rooms, enabling you to share best practices and challenges. For the duration of the program, we will create a real learning community!

Upon completing the program requirements, you will receive a certificate from the College of Business Administration at Florida International University.

Schedule

This online program will be available in March 17 through June 27, 2008.

Tuition

The total cost of this online program is $1,895 (Single participant fee)

CRM Best Practices Research Papers

Posted in February 2008, Newsletter | Tagged , , , , , , , , , | Leave a comment

Understanding Business Intelligence – Part 4

In this article, we will dig in more deeply into the Business Intelligence reporting elements by explaining the basics of multidimensional analysis and the differences with operational reports.

As we mentioned in our previous articles, business managers who need to make better and faster decisions require useful information that needs to be readily available, simple and flexible to analyze.

Unfortunately, most of the times, there is a big gap between the information that business people need and the enormous amounts of raw data that is accumulated through out the years.

Multidimensional Analysis

We explain these new concepts by way of an example.

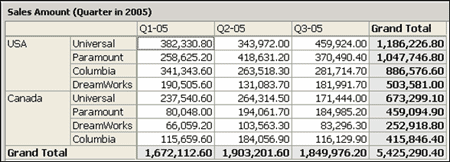
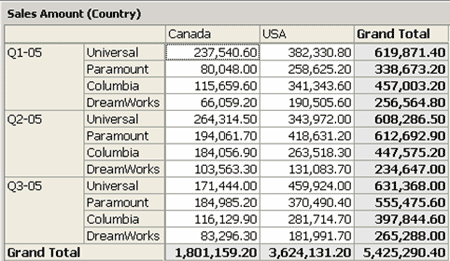
In the figures below, you can see sales broken by three distinct categories: time, region (country) and Product Category.  These categorizations are called dimensions.


Figure 4.1

When we combine these dimensions we get what is called a multidimensional view of the data.

For this example, the figure below combines all three dimensions:


Figure 4.2

Now with this multidimensional view of data, we will be able to see patterns and anomalies. For example, there is a clear sales increase in category “DreamWorks” on the second quarter of 2005 in Canada.

This process of interacting with multidimensional views of the data (also called slicing and dicing) usually reveals new and interesting information compared to the single-dimension type shown in figure 4.1.  This is called multidimensional analysis and it involves viewing data organized along many dimensions.

Operational reporting vs. OLAP

Most operational databases and applications’ main job is to support the day-to-day operations of a company (e.g.: order entry, general ledger, CRM). The databases are structured to process day-to-day transactions efficiently.  These databases usually contain enormous amounts of very detailed raw data.  They are not structured for effective business analysis.

Reporting directly from these detailed databases, when multiple summarizations and groupings are needed requires too much time for processing and usually impact the overall performance of the entire database.

Although these types or reports are an essential component of the decision support process, they usually suffer from at least two basic limitations.

The first limitation is that they rely only on the internally gathered information without the ability to access and combine data that might be available in other systems.  This limits the possibility of creating several metrics and key performance indicators (KPIs) that could be constructed from multiple source systems.

The second limitation is that they are not effectively designed and structured to support multidimensional analysis at the speed of thought.  Typically these reports are slow, less intuitive and have very little flexibility when it comes to combining different dimensions into one view.

Online analytical processing (OLAP) systems provide databases and interface tools that allow instantaneous access and easy manipulation of the data by the end user.  Typically, users that are not necessarily trained as analysts can understand and quickly relate to the conceptual model that OALP systems create.  It is also very fast for the end user.

In our previous examples, time, region  and product category are dimensions for business activities.  The Sales Amount figure is called measure.

OLAP System Structures

A dimension is a categorically consistent view of data.  An important attribute of a dimension is its ability to allow a user to slice and dice multidimensional data.

When we slice a dimension we are selecting a specific member of a dimension, for example “USA” in the Country dimension.

When we dice in OLAP, we create a series of intersections for a given slice with data from other dimensions.  For example we can see sales for country “USA” by quarter and by product category.  “By” indicates how we are dicing the data.

Another important attribute of OLAP’s multidimensional design is the ability to pivot and nest dimensions.

For example, in sample report, an end user could very easily pivot the Region dimension with the Time dimension and obtain a complete different view by just doing drag and drop on the report.


Figure 4.3

Common OLAP terms

These terms are the most commonly used in OLAP technologies.

  • Cube:  A multidimensional storage representation of the data.  Cubes are made of cells that contain among other attributes, the data for each intersection of all dimensions.
  • Dimension:  A categorically consistent group of members represented as a specific axis of an OLAP cube.  Typical dimensions are time, customers, products, geographic regions, distribution channels, etc.
  • Hierarchy: The organizations of levels within a dimension that reflects how additive data is aggregated level by level and the top-down drill down path for users within the dimension. A typical hierarchy would be a time hierarchy made of Year – Quarter – Month – Day.

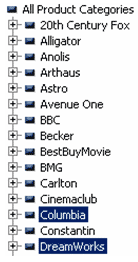
Figure 4.4 below shows the Product Category hierarchy where two members (Columbia and DreamWorks) have been selected or sliced.


Figure 4.4

  • Member: The name or label for any member at any level in a hierarchy.  The bottom level members are called leaf members.  In figure 4.4, Anolis, Astro and BBC are members of the dimension Product Category.
  • Measure: Is any quantitative expression that you need to measure.  Examples are: sales amount, sales quantity, average cost, etc.  A measure is always analyzed across multiple dimensions, for example sales by quarter, by region and by product category.

Measures are either derived from the original data source (e.g.: sales) or calculated (e.g.: average selling price).

Summary

A special feature of OLAP systems is the ability to write simple formulas that automatically calculate across multiple dimensions. This ability allows OLAP analysts and administrators to perform complicated calculations typically not possible in a normal spreadsheet environment.

The gap between raw data and business information can be bridged through the processes that integrate transactional systems with Business Intelligence systems.  OLAP systems enable ad hoc analysis and building reports on-the-fly that allow the end user to slice and dice their data by different dimensions and pivot these dimensions to respond to questions very quickly and visually detect trends, patterns and anomalies that would be very complex and time consuming with single-dimensional analysis.

If you need assistance or would like more information on BI, please feel free to contact us at info@axisgp.com. To view previously published articles on BI solutions please visit us at AXIS Newsletter Archive.

Posted in February 2008, Newsletter | Tagged , , , , , , , , , , , , , , | Leave a comment

FMLA (Family Medical Leave Act) Changes

Recently, President Bush signed the first changes to the Family & Medical Leave Act (FMLA) since the law was enacted 15 years ago. And then, on February 11, the DOL proposed major changes to the existing rules. The new military FMLA rules take effect immediately!

Military FMLA Leave

First, the new military leave law requires employers to provide up to 26 weeks of FMLA leave to eligible employees to care for recovering injured or ill service members and 12 weeks of leave because of any qualifying "exigency" arising out of the fact that a covered family member is or has been called to be on active duty. The "qualifying exigency" provisions will not be effective until the DOL issues final FMLA regulations defining the term "qualifying exigency." The rest of the law went into effect on January 28.

Proposed Changes to FMLA

The Department of Labor published proposed changes to the FMLA on February 11, that would, in the opinion of many employers, clarify some aspects of FMLA that have proved troublesome in the law’s 15-year history. These include:

  • Tightening of notice requirements … on both sides. Employees would now have to let the boss know they need FMLA leave no later than the next day following a qualified need for the leave. Now workers can take 2 days before they report in. What’s more, they’ll need to follow tighter call-in procedures. For their part, employers will now have to provide notice of FMLA rights annually, but will have longer to provide designation of leave – 5 days instead of the current 2 days.
  • Easing of medical certification. Under current law, employers are barred from contacting a worker’s health provider about the need for leave. The proposed changes would remove that restriction. Some employers have looked for this change so doctors have fuller information about the worker’s responsibilities and working conditions before making judgments on a worker’s need for time off.
  • Continuing treatment redefined. Workers now can qualify as needing continuing treatment if they make two medical visits over any period of time … even months. The new changes would require those two visits in a 30-day period, making it more likely that there really is a serious condition present.

In addition to the above, there are further proposed changes dealing with how nonconsecutive periods of service are calculated to determine FMLA eligibility, and other matters.

For more information on the changes to FLMA please refer to the following  Department of Labor website http://www.dol.gov/esa/whd/ .

Posted in February 2008, Newsletter | Tagged , , , , | Leave a comment

Sage Accpac ERP – New Features in AR 5.4

Sage Accpac ERP 5.4 has quite a few new features pertaining to the customer information in the Accounts Receivable module. We will look at three of these features that make the customer information more flexible and easy to navigate.

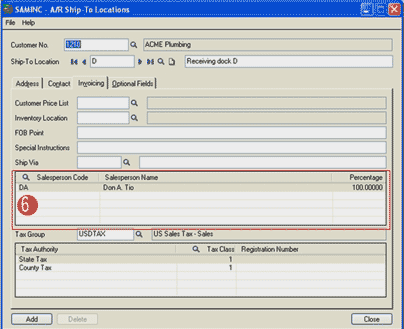
The first feature allows a user to automatically use the customer’s salesperson information when setting up a new ship-to location for the customer. This makes it easier for the user to set up the ship-to location without being concerned about entering the salesperson. Yet, it is flexible enough so that different salesperson information can also be entered.

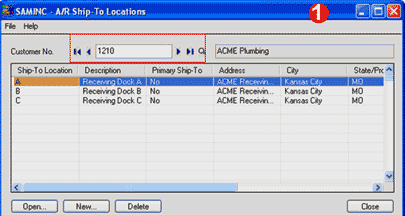
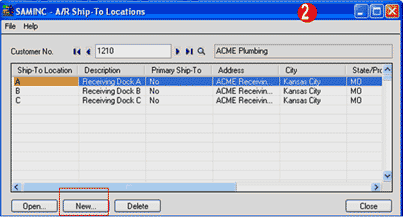
Select Accounts Receivable > A/R Customers > Ship-to Locations.

1. Enter the Customer Number that will have the new Ship-To Location.

2. Click on the New button at the button of the screen.

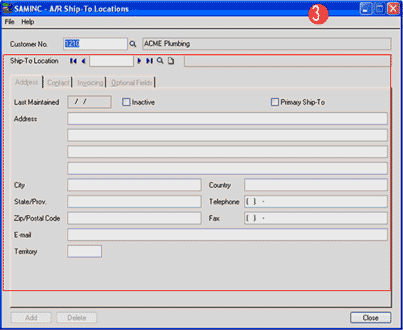
3. Enter a unique Ship-To Location code for this customer and fill out the address information for the Ship-To.

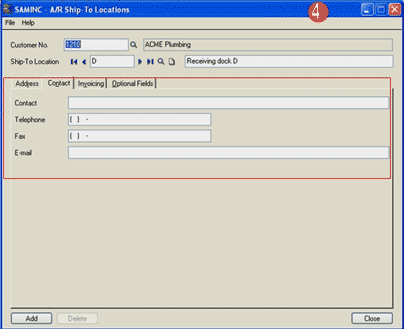
4. Enter the Contact information for this Ship-To Location.

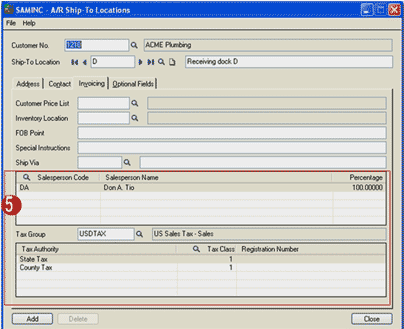
5. On the Invoicing tab, note that the Salesperson Sode and Tax Group are a default from the customer information. You can change the salesperson and the tax group if they are different than the customer. Enter the Customer Price List, Inventory Location, FOB Point, any Special Instructions, and select the Ship Via for this Ship-To Location if applicable.

6. To change the Salesperson Code, click on the line with the incorrect Salesperson Code and a list of salespeople will appear. Select the correct salesperson. Note that you can enter up to five salespeople if that is required for this Ship-To Location.

If the Tax Group needs to be changed, then select the correct Tax Group. When the Tax Group is correct, click on the Add button and this Ship-To Location is added.

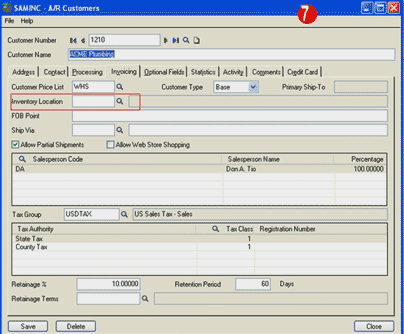
The second feature allows users to set up a default inventory location for the customer. Just like we can select a default inventory location for the ship-to location, we can specify a default inventory location for the customer so that goods are shipped from the nearest warehouse location. This feature can help in reducing shipping costs and provide faster delivery for customers. The inventory location can be overridden in Order Entry if the user has the proper privileges.

Select Accounts Receivable > A/R Customers > Customers.

7. Whether you are entering a new customer or want to edit an existing customer, the default Inventory Location is selected the same way. On the Invoicing tab there is a field called Inventory Location, click on the finder to show the options for Inventory Location.

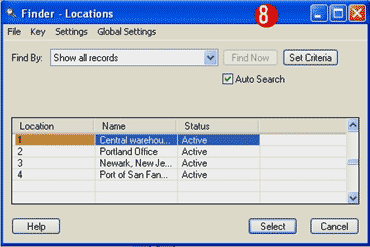
8. Highlight the Inventory Location and click on the Select button at the bottom.

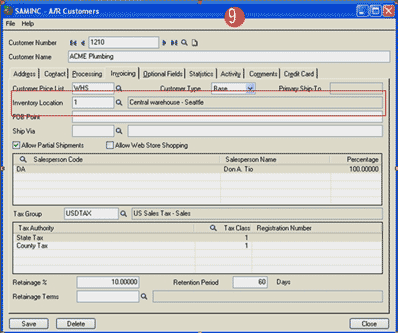
9. The default Inventory Location is set. If you are finished, click on Save.

The third feature of Sage Accpac ERP 5.4 is the ability to save the selections you make to view transactions within Customer Activity so that they can be used as defaults. This saves time when the same criterion is used on a regular basis.

Select Accounts Receivable > A/R Customers > Customer Activity

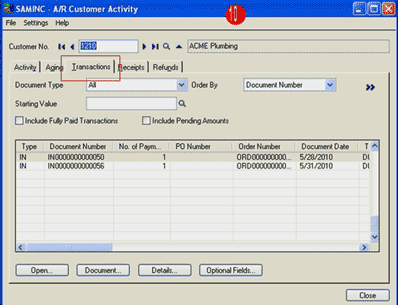
10. Enter the Customer Number or click on the Finder to locate the correct customer and click on the Transaction tab. In this example, the default is Document Number order, which is setup in A/R Options.

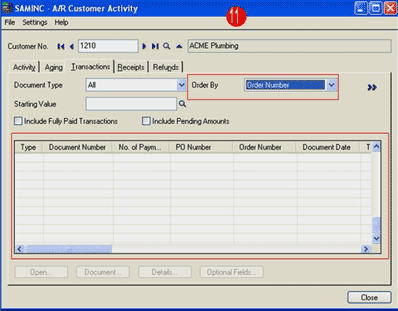
11. If you want to see the documents in Order Number order, click on the pull down and select Order Number. Please note that there are no documents listed. The documents won’t show up until you either tab over or click on the double arrows.

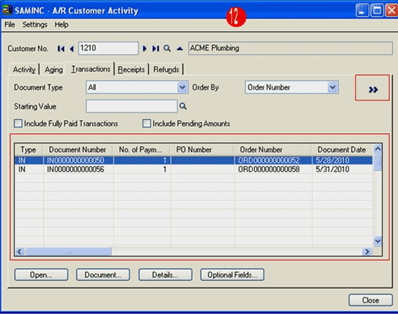
12. The documents are now sorted in Order Number order. You can select more criteria by looking for a particular document type (i.e. invoices), or a starting value, and so on. Once you have set the criteria, you may want to use these new criteria as the default for this customer activity.

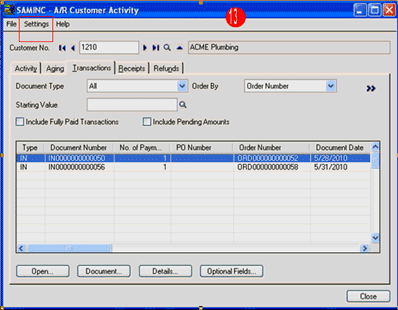
13. Click on Settings at the top of the screen. You will have 2 options:

1. Save Settings as Defaults
2. Clear Saved Settings

If you select Save Settings as Defaults, the criteria that you entered will now be the default every time the Customer Activity is accessed. If you decided that you don’t want to keep these as defaults after you have saved them, click on Settings at the top of the screen and select Clear Saved Settings.

By utilizing these features, the entry and lookup of customer data is streamlined and easy to use.

If you have any questions or need additional assistance, please contact your AXIS consultant or email us at info@axisgp.com for more information.

Posted in February 2008, Newsletter | Tagged , , , , , , , | Leave a comment

The User of Baseline Assessments in the Shipping Function

Overview

This article will discuss how to formulate a baseline assessment to better evaluate the impact of shipping automation during the decision making phase and after implementation. Key baseline factors will be identified and considerations for measurement and evaluation will be given. An example is included to highlight the specifics of creating a baseline assessment. 

The Importance of Baselines

Baselines are objective measures determining a well defined aspect of an organization’s activities. Typically, qualitative in nature, accurate baselines are used as a reference to measure the impact of change and to help estimate or project how certain decisions (like implementing a new software system) will improve operations. Consequently, conducting baseline assessments allow organizations to make better business decisions and continually improve their operations.

For the purposes of this article we’ll discuss developing and using a baseline for the shipping function. The measure will be the amount of money an organization spends monthly on their direct freight charges and all shipping related activities.

Shipping Baseline Factors

Below is a list of the typical (on-going) expenses an organization will incur to run and manage their shipping activities. Our baseline assessment will consist of the sum of all monthly costs related to the activities listed.

  • Actual monies expended on courier & LTL carriers
  • All related monies expended to manage and use their own fleet
  • Shipment Preparation (including shipping labels, waybills and other related documents)
  • Inquiries on Shipment Status and Tracking
  • Shipment Cost Accounting
  • Carrier Bill Audit & Reconciliation

The common denominator for our baseline will be a dollar value so for some of the activities listed an equivalent dollar amount needs to be calculated by factoring in all related employment costs (health benefits, taxes etc.) for the staff members involved.

Use of the Baseline

There are two primary uses for a baseline assessment. First, it provides a convenient way to create a business case by knowing the cost of what we do today and how that is expected to change in the future. The business case is nothing more then determining the monetary impact compared to the cost of taking some specific course of action such as implementing a software system. If favorable enough, the business case will present the rationale for a decision to move forward.

Second, it is used to measure change over time – by comparing your position with your established baseline, changes, both positive and negative, will be identified allowing the company to take any necessary action. There are many examples of cost creep due to subtle changes that go unmeasured and hence undetected by management that deteriorate performance.

The graph below shows an example of measuring our total monthly costs at various points in time to highlight a trend. In this case the present bar is our baseline assessment that we measure against set times in the future. The frequency of measurement will depend on the importance of the area being assessed, how quickly it changes and the cost of that measurement.  
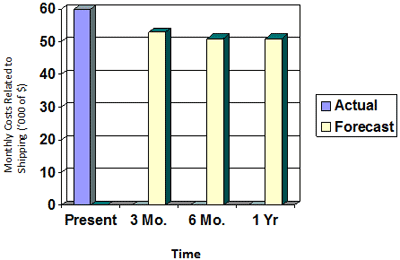
In making a decision to purchase a shipping automation system we would do our baseline assessment and then project how we expect it to change in the future.

Based on that change a measure of a return on investment can be calculated by using:

Return on Investment (ROI) = Total Related Savings ÷ Total Cost of Shipping Automation

The calculation needs to have an assumed time period that reflects the expected life of the system to be implemented. The expected costs and savings will be calculated for that time period. For most computer related projects the assumed time period will be between 3 and 5 years.

Measuring the Baseline

The table below lists each of the factors in our baseline assessment along with how to measure each and the type of savings you can expect from the implementation of a well suited shipping automation system. 

Baseline Factors

Measurement

Expected Savings

Actual monies expended on courier & LTL carriers

Review your carrier bills for the last three months and take the average spend per month.

Most shipping automation systems include a rate shopping facility that allows the shipper to choose the most cost effective carrier and shipping method. For companies using more than one carrier on an on-going basis savings from rate shopping should be between 2 and 5%. Savings could also be realized by limiting the types of carrier services available to the user – limiting the most expensive services in order to decrease overall costs.

Shipment Preparation (including shipping labels, waybills and other related documents)

Work with your shippers and time how long it takes to prepare 20 shipments. Calculate the average time spent per shipment and then compare that with what the expected time will be using a shipping automation system. Once you know the time savings per shipment multiply by the average number of shipments per month to determine total time savings. Convert this time saved to a dollar value using the total cost of your shipper.
For customs invoice and dangerous goods documentation preparation take the average of five exemplary shipments to get an average time per document type.       

Shipment processing, dangerous goods and customs invoice documentation should take no more than between 1 and 1.5 minutes per shipment or document using a shipping automation system.

Inquiries on Shipment Status and Tracking

Review how staff look up shipment status and tracking information. Consider the times involved for different types of users and work an average time to successfully make an inquiry. How many inquiries are made (on average) per month? Work out the cost based on the time spent and the cost of staff.

This type of information should be easily accessible to anyone who needs it. Typically a lookup should take no more than 30 seconds to get what’s required. Consider if inquiries can be made by the customer themselves thereby reducing or eliminating any staff involvement in this activity.

Shipment Cost Accounting & Carrier Bill Audit with Reconciliation

Review how staff currently cost account for each shipment and how they audit and reconcile their carrier bills. Typically these processes are done by a designated person and the amount of time they spend in this activity should be easily obtained. Work out the monetary value based on the cost of staff.

Cost accounting should be automated at least to the point of having an electronic file available of all shipments and associated shipping costs tied to a cost accounting code. This could be automated to be imported into accounting on a regular basis or at least easily available from the system for data entry.
Bill audit should be automated with an exception reporting capability that takes, as input, the electronic carrier bill, and produces a report against actuals to ensure the proper costs are being billed and identifies the problem areas. The time spent to administer this can be estimated based on speaking with the vendor or preferably with other customers who have used the system.

Single Biggest Benefit Approach

In some cases working out the costs in each of the activities may be difficult to do or you may want a quick way to justify the purchase of a shipping automation system. A simplified approach is to consider each of the cost areas and determine where the obvious biggest benefit will be. Very often the activities of greatest inefficiency can be identified. If the system can be justified on that basis alone the other benefits and cost reductions will simply be a bonus. For example, if an organization is manually producing waybills and shipping labels and the volumes are high, a simple calculation of the time currently spent against what a typical shipping automation system will deliver may easily pay for itself.

Determining the Total Cost of Ownership

A key component in justifying the implementation of shipping automation is the true total cost of purchasing, supporting and maintaining the system (the denominator in the ROI calculation). For traditional software the obvious cost is that of the software itself. Not so well known is that on average it is estimated that the total cost of ownership is double the initial cost over the span of using the software. This is a good rule of thumb to validate costs. For any particular system all related costs should be identified and if possible, reference sites of similar nature should be contacted to ensure the total cost picture estimated is accurate to what actually will happen.

With the advent of SAAS (software as a service) offerings, the monthly and total costs for a period of time are more easily determined given the total fee charged usually includes all aspects of software delivery. A total cost over the time period is simply determined by multiplying the monthly fees by the total number of months of expected usage and evenly spreading any initial setup and config fees evenly over the time period considered.

Baseline Example & ROI Determination

To quantify the baseline discussion the following example will be used. The numbers were taken from an actual case study and are meant to outline exactly how to create a baseline assessment for the shipping function.

Characteristics of the Shipping Function (where applicable numbers are measured per month)

Courier Volume:                                       6,000 shipments
Total Courier Spend:                               $65,000
# of Shipment Inquires                          900
Avg. time on shipment inquiry:          5 min. / inquiry
Avg. Shipment Preparation Time:     3 min. / shipment
# of Customs Invoice to Prepare:      600
Customs Invoice Preparation Time: 10 min. / invoice
Dangerous Goods Preparation Time: N/A
Cost Accounting:                                      not required
# of Carrier Invoices                                                15
Time to Audit Each Carrier Invoice:   180 min.
Hourly costs of staff (all in):                 $15
Assumed Time Period:                          48 months
Total Cost of Shipping Automation:  $70,000

Baseline Factors

Measurement

Expected Savings

Actual monies expended on courier & LTL carriers

$65,000

$1,950 (3% of spend)

Shipment Preparation (including shipping labels & waybills)

$4,500
[6,000 X 3 min ÷ 60 min X $15]

$2,625
[$2,250 = $4,500 – $1.875 (1.25 min X 6,000 ÷  60 min X $15)]

Document Preparation

$1,500
[600 X 10 min ÷ 60 min X $15]

$1,275
[$850 = $1500 – $225 (600 X 1.5 min / 60 min X $15)]

Inquiries on Shipment Status and Tracking

$1,125
[900 X 5 min / 60 min X $15]

$1,012
[$1,012 = $1,125 – $113 (900 X .5 min/60 min X $15)]

Shipment Cost Accounting

N/A

N/A

Carrier Bill Audit & Reconciliation

$675
[15 X 180 min/60 min X $15]

$375
[$375 = $450 – $300]

Totals

$72,800

$7,237

 
Based on the example we’ve established our baseline at a total spend of $72,800 per month and we expect (project) to realize a monthly savings of $7,237 from the implementation of a shipping automation system.

To determine the ROI we can use the following formula (assuming a time period of 48 months):
        Return on Investment = Total Related Savings ÷ Total Cost of Shipping Automation
        Return on Investment = $347,376 / $70,000 = 496%

Post implementation Evaluations

Once you’ve made the decision to proceed with shipping automation based on completing your assessment and establishing a good business case you should setup a process to measure the baseline 90 days after implementation.  This will provide adequate time for adoption and the system should be running as intended. All baseline costs will be re-assessed to determine a total monthly cost and compared to planned. Any deviations should be examined and corrected.

Due to changes that occur over time in process and in policy a business should re-evaluate its process periodically (e.g. yearly) to ensure that the performance is being maintained or even improved.

Very often the implementation of software will allow organizations to re-think how they conduct their operations and further costs savings can be realized. The baseline measurement will provide continual feedback on what impact changes are having.

Written By:
Michael Trueman
Executive VP & Co-Founder,
Go-Logix Technologies Inc.
mtrueman@go-logix.com
www.go-logix.com

This list assumes the organization is using 3rd party carriers to handle all their shipping. As such expenses related to managing a using their own fleet of trucks is ignored.

Posted in February 2008, Newsletter | Tagged , | Leave a comment

Frequently Asked Questions

Sage
Accpac ERP

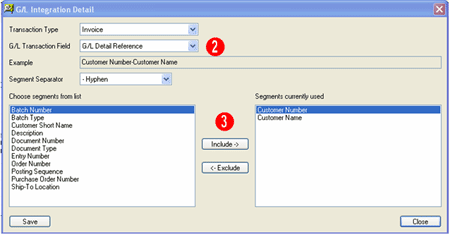
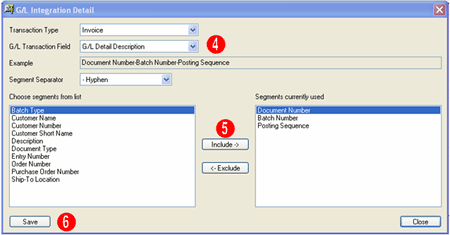
Q – Is there a way to transfer additional information to the General Ledger when posting Accounts Receivable Invoice entries?  We would like to include the Customer Name and Number information in the GL Reference Field and the Document Number, Batch Number, and Posting Sequence Number in the GL Description Field in the Transaction Listing report in the General Ledger.

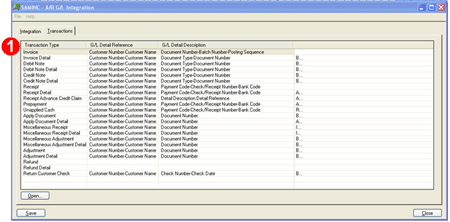
A – In Sage Accpac ERP v5.4, there is new icon called G/L Integration under Accounts Receivable – A/R Setup.
To setup the G/L Integration to include this information:

  1. Select the Invoice and click on the “Open” button.

  1. In the G/L Transaction Field, select the G/L Detail Reference field.
  2. Select Customer Number and click on “Include”.  Next, select Customer Name and click on “Include”.

  1. In the G/L Transaction Field, select the G/L Detail Description field.
  2. Select Document Number and click on “Include”.  Next, select Batch Number and click on “Include”. Next, select Posting Sequence and click on “Include”.
  3. Click on the “Save” button

Q – Is there a way to setup security where a user cannot see costs when entering a receipt?

A – In Sage Accpac ERP v5.4, users with Receipt Entry rights only in the Purchase Order module can create receipts from POs, specify quantities received, and post receipts, but they cannot see any cost information.

Sage Accpac
CRM

Q – How do I activate “On-screen Coaching”

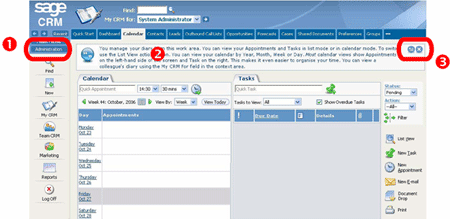
A – In SageCRM v6.0, when “On-screen Coaching” is activated, text can be displayed in a frame at the top of each screen to explain where the user is and what they can do in that screen.

The content of “On-screen Coaching” frames is determined by the administrator and there is no limit on the amount of content that can be included on any one screen.  You must have Administrator rights in order to activate “On-screen Coaching”

To activate “On-screen Coaching”:

  1. Select Administration | System | System Behavior.
    Click on the Change button.
    Select Yes from the Allow Coaching in CRM drop-down menu.
    Click on the Save button to save the new settings.
  1. “On-screen Coaching” is displayed at the top of screens for which coaching has been created.
  2. You can minimize or turn off on-screen coaching for individual pages using the buttons in the corner of the coaching panel.

Q – What can I access from the new Quick Start tab?

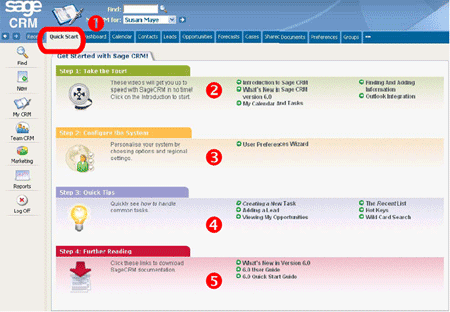
A – There is a new Quick Start tab on the My CRM screen in SageCRM v6.0. From this tab, you can access CRM system documentation, online training videos, system quick tips, the User Preferences wizard, and the System Administrator Quick Setup Guide.

To access features on the Quick Start tab:

  1. Select My CRM | Quick Start. The Quick Start tab is displayed.
  2. In the “Take the Tour” area, you can view video presentations that will take you through some of the key features of SageCRM.
  3. Administrators can access the User Preferences Wizard and the System Administrator Quick Setup Guide from the “Configure the System” area. If you are not an administrator, you can only access the User Preferences Wizard. The User Preferences Wizard allows users to customize their CRM system in a series of quick and easy steps. The System Administrator Quick Setup Guide provides administrators with easy-to-follow instructions on setting up a CRM system.
  4. You can view system quick tips from the “Quick Tips” area.
  5. You can access core system documentation from the “Further Reading” area.
Sage Pro
ERP

Q – Which temporary files can be deleted from Sage Pro ERP?

A – Important
The following should only be done by a Sage Certified Consultant or Business Partner. create a full and verified backup before proceeding. This should first be attempted in a test installation and the results should be fully verified before implementing in a live system.

Sage Pro uses these three types of temporary files:

  • Files beginning with 0
  • .MEM type files
  • .TMP type files

Do not delete any files beginning with "0" that appear in the DocOnDisk directory.  Also, do not delete any .XLS or any .MEM files that begin with FR. For example, do not delete FRSAVE.MEM.

Other temporary files can safely be deleted from all the Sage Pro directories and subdirectories as long as there is no one logged into the program. For more instructions on how to delete these files, please refer to Sage Pro documentation.

Q – Where does the Accrued Time Report get the Pay Rate information from?

A – The Pay Rate information displayed on the Accrued Time Report is taken from either:

Employee Pay Type Maintenance Screen

  1. Open the Payroll (PR) module.
  2. Under the Maintain menu, point to Employee and click Employee Master. The Employee Master Maintenance screen appears.
  3. Type the employee in the Employee ID field
  4. Select Pay Types from the list. The Employee Pay Type Maintenance screen appears.
  5. Select the appropriate Pay Type.
  6. If the Use Regular Pay Rate option is not checked, the Accrued Time Report will use the Pay Rate from the Employee Pay Type Maintenance screen.

The Employee Master Maintenance Screen

If the Use Regular Pay Rate option is checked in the Employee Pay Type Maintenance screen, the Accrued Time report will use the Pay Rate specified in the General tab of the Employee Master Maintenance screen.

Q – Why the Bill of Material configuration screen does not recognize the explosion method set in Work Order Setup?

A – In Sage Pro ERP a multi-level Bill of Material (BOM) is set to Configure During SO Entry and Generate WO on SO Entry. The Default method of explosion is set to "Bottom" in the Work Order (WO) Setup Information screen. When a sales order is created and this BOM is selected as a line item, a dialog box appears asking whether to sell the item or create a work order. When the option to create the work order is chosen, the BOM Configuration screen launches. It lists all the components and subassemblies for the BOM but does not explode the components of the subassemblies as expected for a Bottom explosion.

The Default method of explosion defined in WO has no direct effect on the BOM Configuration screen during sales order entry. The Default method of explosion setting in the Production Entry (PE) Setup Information screen affects the explosion of the components on the BOM Configuration screen. Therefore to see the components of the subassemblies exploded to the lowest level, the Default method of explosion should be set to "Bottom" in PE setup.

Back to Top^
Posted in February 2008, Newsletter | Tagged , , , , , , , , , , , , , , , , , , , , , | Leave a comment

Sage ERP & SageCRM Tips & Tricks

Here are this month’s Tips & Tricks videos to help you learn new features and become more productive with your Sage Accpac ERP and SageCRM systems. Just click the thumbnails to watch and learn! We hope you enjoy them and find them useful. Your feedback is encouraged.

Adobe Flash Player is required

Posted in February 2008, Newsletter | Tagged , , , , , , , , , , , , , , , , , , | Leave a comment

Could Not Have Done it Without YOU!

AXIS Integrated Solutions Named “Technology Pacesetter & VAR 100 for the Second Consecutive Year

SourceMedia, the publisher of Accounting Technology, Accounting Today, and Practical Accountant, issued their annual list of technology "Pacesetters," their "Select 100," as chosen primarily by Accounting Technology Editor-in-Chief Bob Scott. The 2007 Pacesetters are chosen as follows: "Pacesetters distinguish themselves through their performance. Factors that went into this selection include awards won by the organizations, leadership, industry reputation, sales per employee and growth.  Whatever the size, the goal of the Pacesetter is to recognize that quality comes in many different shapes, specialties and sizes. And that is what Pacesetters is all about – QUALITY.”

On behalf of the partners, Kelly Hummel, Tony Chiodo and Manny Buigas, we extend our heartfelt appreciation for the opportunity to serve you as your trusted business advisors and look forward to continue to earn your trust and create mutual wins for years to come.  We would also like to take this opportunity to thank our dedicated group of consultants for their commitment to excellence, world-class customer service and dedication to their profession.

Posted in January 2008, Newsletter | Tagged , , , , | Leave a comment

New Trends in E-Commerce Drive Better Technology

Data entry is costly. How would you feel if your customers insisted on doing it for you?

It isn’t quite as preposterous as it sounds. Today, more and more customers are demanding that their suppliers offer on-line stores. If you meet this demand with a Web store that integrates to your accounting system; you’ve effectively enlisted your customers to do their own order entry and invoicing. Take these examples into consideration:

  • A medical supply company in Northern Canada provides its clients with an integrated web store and cuts data entry costs by $100,000 per year.
  • An integrated web store allowed a Vancouver supplier to increase sales, but decrease inbound phone calls by 40 to 50 percent, because his clients can now find, reprint, and check orders and invoices on-line. Net savings – one salaried employee.

E-commerce has been around for some time—so what’s driving this new trend? According to Ipsos Insight’s, over 72% of all households in North America are now online and want more and better ways to utilize the internet. One way to achieve that is through easier online shopping, which is expected to continue double digit growth through 2011.

E-commerce is making an even bigger impact on the business-to-business world. IDC, a major supplier of market intelligence to the IT industry, has forecast that global business-to-business transactions will exceed one trillion dollars in 2008. So smart businesses are looking to the Web to manage accounts receivable, increase customer service, and reduce the cost of data entry.

How has e-commerce technology changed to meet this new demand? In the early days of the Internet, many companies implemented standalone Web stores that were separate from their accounting system. This meant managing inventory in both locations and hand-keying orders received from their Web store. These Web stores gave customers the ability to place orders online at their convenience, but often the orders were error-ridden in the accounting system because the Web site was out of date or the order was incorrectly re-keyed. The online stores often caused more problems than they solved—and certainly did not show much of an ROI.

In response, a new generation of Web stores has hit the market. These solutions are feature-rich, completely customizable, are fully integrated to the accounting system and support both business-to-business and business-to-consumer sales. All pricing is managed from the inventory module using the appropriate price list for each client. To change pricing on any item, you simply change it in the inventory module and the new price automatically flows to the Web store. The Web store also writes orders directly into the accounting system so there is no re-keying. And you reap the benefits because your customers do your data entry.

In addition, these new Web stores offer many customer self-service options. Accounts receivable and order history is displayed on the Web. Customers can re-order past or existing orders with a single click of their mouse. They can use their credit cards to pay online, too—either during order entry or periodically by viewing all their open invoices.

If you’d like to leverage e-commerce technology to improve customer service, increase customer loyalty, and reduce your data entry, consider a solution that integrates with your Sage Accpac ERPsystem: eCommerce for Sage Accpac ERP, powered by Iciniti. This leading-edge, customizable Web store solution has the sophisticated features your customers demand while being fully integrated with Sage Accpac. For more information, please contact us at info@axisgp.com.

Posted in January 2008, Newsletter | Tagged , , , , , , , , , , , , , , | Leave a comment

Automating Shipment Processing

Overview
Shipment processing and its related activities are an important but often overlooked function in supply chain management. Unfortunately, too many organizations are losing money and compromising customer service levels by not implementing solutions to improve this function. Technologies exist today that are easy to implement and integrate which provide quantifiable, on-going benefits.

This article will describe what “best in class” organizations are doing to automate their shipping function and the benefits they are deriving from their investments in this area. We will also look at the key areas to consider in selecting a shipping management technology.

The Shipping Cycle – Integrated Automation
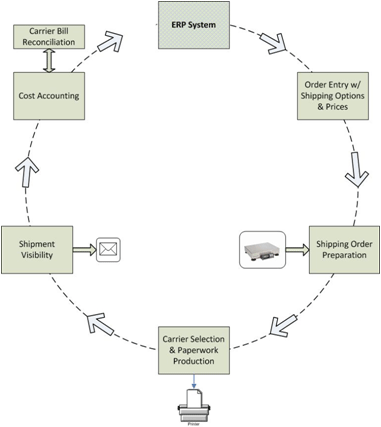
The schematic below highlights a well integrated and highly functional shipping management system – each function is described on the right.  The term “the application” refers generically to the installed shipping management system.

Orders are entered into the organization’s ERP system and at the time of entry, their shipping options (carriers & services) and corresponding prices are conveniently available to the operator. The preferred service and carrier are identified in the order if applicable.

Once the order is ready to be shipped, it is retrieved through the application and order data pertinent to the shipment is automatically loaded. The shipper then defines the final shipment parameters including package size, weights (using an attached weigh scale) & special services.

Based on the shipment parameters the application will present the shipper with their shipping options including the days in transit and the price of the shipment – highlighting the preferred service & carrier from the order. The service and carrier is confirmed and all the necessary paperwork (i.e. compliant shipping labels or waybills and customs invoice docs for international shipments) is automatically printed.

Once committed, the shipment is visible to any authorized user (internal or external to the organization) allowing it to be tracked up until delivery. E-Mail notifications are sent to recipients notifying them of impending shipments and to specified individuals confirming that a shipment has been delivered.

As a final step, pertinent shipment information is automatically written back to the ERP system including carrier, service level, tracking numbers, additional reference information and shipment cost. Carrier invoices are electronically verified and reconciled in preparation for payment.

Benefits
By automating the shipping function and its related activities as shown the following benefits may be realized.

  • Reduction in Direct Shipping Costs
  • Smart Carrier Selection – For each shipment or order processed a cost comparison between available carriers and services is displayed so that the most cost effective carrier can be chosen based on the defined shipment parameters. Savings of between 7 and 15% on the overall shipping spend can be achieved.
  • Improved Carrier Negotiations – By electronically capturing every shipment processed it enables you to have a complete picture of your shipping patterns. This information is critical in negotiations with carriers and can help reduce your direct shipping costs by as much as 10%.
  • Improve Efficiencies
    • Automatic Shipping Labels & Waybills – By quickly retrieving order information and specifying the shipment parameters and automatically producing a “carrier ready” shipping label or waybill the time consuming and error prone method of preparing paperwork is eliminated – shipment preparation time can be reduced by as much as 75%.
    • Integrated Tracking & Automated Status Updates – By quickly being able to retrieve shipments (by any number of references) with their current status and access to detailed carrier tracking information efficiencies will be gained in shipment follow up.
    • Carrier Bill Reconciliation – By reconciling carrier invoices against a record of what was shipped and corresponding contract costs, bill payment can be verified and prepared without the time consuming procedure of manually auditing each invoice and record.
    • Universal Accessibility – The application and information is available to any authorized user allowing for casual, non production shipments to be placed and inquiry and reporting to be executed from any workstation.  
  • Improve Customer Service
    • Automated e-Mail Notices – Automatic advanced shipment notifications and delivery confirmations via e-mail allows for better shipment follow up and communication.
    • On-Line Quoting – Having comparative quotes by carrier and service quickly available allows for a fast and easy way to let customers know precisely what their shipping options and charges will be.
    • Quick Status Lookup –  By having current status, detailed tracking and POD information immediately available quick response to customer inquiries can be made. Alternatively this information can be extended to your customers giving them access to the same convenient tools without occupying your staff’s time.

Each organization will derive varying benefit depending on their operations. Organizations need to develop a baseline of current methods and associated costs before looking for a solution that has the features delivering the most value. After implementation the return on investment can be simply quantified based on the new methodologies / costs vs. the original baseline established (please refer to our paper entitled “Establishing Baselines in Shipping Automation” for more information on this subject).

Shipping Management Software Considerations
When selecting shipping automation software the following general considerations should be taken into account regarding the application’s functionality and return on investment. 
Note: The list does not include a review of the considerations that should be given regarding the vendor (reputation, time in business etc.) as it is expected that each organization does this as a matter of business and that they have their own evaluation criteria.

  1. Integration into your ERP (Accounting) System
    Ensure that the solution can seamlessly connect into your ERP system to allow for the quick conversion of orders into shipments and the write back of key shipping information to the order. Further, the application should allow the order entry person to quickly retrieve shipping options and prices at the time of order entry.
  2. Multi-Carrier Compliance
    Ensure that the solution is compliant with all major shipping carriers (couriers and transport companies). Requirements change and you may need to go to a different carrier in the future. By choosing a solution that has a broad compliance base ensures your solution will work in the future no matter which carriers you choose to do business with.
  3. Speed of Processing Shipments
    In higher volume shipping situations the physical preparation of each shipment becomes critical and an interface that is intuitive and fast becomes imperative. Weigh scale integration and paperwork that will print quickly once the shipment is committed are both time savers. Try the application in a test with one or more of your shippers to see how easily they can “get up to speed” and how long a typical shipment will take. This information will be insightful and helpful in estimating your return on investment.
  4. Universal Access & Visibility
    Shipment information is important to many people in an organization – ensure that the application allows for easy, ubiquitous access to those who need it. With the introduction of web based shipping technologies this is now becoming as easy as an inquiry through a browser to get the latest status and carrier tracking information. E-Mail notifications should be automatic and available for recipient notification, delivery confirmation and exception (late shipments) alerts.
  5. Return on Investment & Total Cost of Ownership
    Work your business case based on the key quantitative benefits identified (see “Benefits”) and ensuring you keep in mind the total cost of ownership in the application solution. Estimates put the capital cost of software at about ½ the full cost of owning and maintaining a multi-user software system. Be aware of upgrade, support and other maintenance fees that may hit you after the purchase is made. Consider SAAS (software as a service) solutions that charge based on usage per month and hosted by the vendor. This alternative lowers your upfront costs and enables the application to be piloted before making a full commitment. It will also allow for a quicker pay back on your investment.

Written By:
Michael Trueman
Executive VP & Co-Founder,
Go-Logix Technologies Inc.
mtrueman@go-logix.com
www.go-logix.com

Posted in January 2008, Newsletter | Tagged , , , , , , | Leave a comment