
In this article, we will dig in more deeply into the Business Intelligence reporting elements by explaining the basics of multidimensional analysis and the differences with operational reports.
As we mentioned in our previous articles, business managers who need to make better and faster decisions require useful information that needs to be readily available, simple and flexible to analyze.
Unfortunately, most of the times, there is a big gap between the information that business people need and the enormous amounts of raw data that is accumulated through out the years.
Multidimensional Analysis
We explain these new concepts by way of an example.
In the figures below, you can see sales broken by three distinct categories: time, region (country) and Product Category. These categorizations are called dimensions.
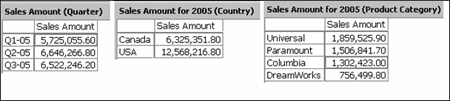
Figure 4.1
When we combine these dimensions we get what is called a multidimensional view of the data.
For this example, the figure below combines all three dimensions:
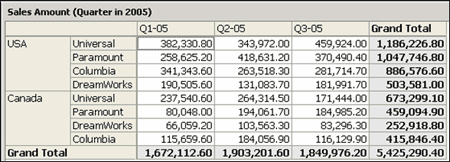
Figure 4.2
Now with this multidimensional view of data, we will be able to see patterns and anomalies. For example, there is a clear sales increase in category “DreamWorks” on the second quarter of 2005 in Canada.
This process of interacting with multidimensional views of the data (also called slicing and dicing) usually reveals new and interesting information compared to the single-dimension type shown in figure 4.1. This is called multidimensional analysis and it involves viewing data organized along many dimensions.
Operational reporting vs. OLAP
Most operational databases and applications’ main job is to support the day-to-day operations of a company (e.g.: order entry, general ledger, CRM). The databases are structured to process day-to-day transactions efficiently. These databases usually contain enormous amounts of very detailed raw data. They are not structured for effective business analysis.
Reporting directly from these detailed databases, when multiple summarizations and groupings are needed requires too much time for processing and usually impact the overall performance of the entire database.
Although these types or reports are an essential component of the decision support process, they usually suffer from at least two basic limitations.
The first limitation is that they rely only on the internally gathered information without the ability to access and combine data that might be available in other systems. This limits the possibility of creating several metrics and key performance indicators (KPIs) that could be constructed from multiple source systems.
The second limitation is that they are not effectively designed and structured to support multidimensional analysis at the speed of thought. Typically these reports are slow, less intuitive and have very little flexibility when it comes to combining different dimensions into one view.
Online analytical processing (OLAP) systems provide databases and interface tools that allow instantaneous access and easy manipulation of the data by the end user. Typically, users that are not necessarily trained as analysts can understand and quickly relate to the conceptual model that OALP systems create. It is also very fast for the end user.
In our previous examples, time, region and product category are dimensions for business activities. The Sales Amount figure is called measure.
OLAP System Structures
A dimension is a categorically consistent view of data. An important attribute of a dimension is its ability to allow a user to slice and dice multidimensional data.
When we slice a dimension we are selecting a specific member of a dimension, for example “USA” in the Country dimension.
When we dice in OLAP, we create a series of intersections for a given slice with data from other dimensions. For example we can see sales for country “USA” by quarter and by product category. “By” indicates how we are dicing the data.
Another important attribute of OLAP’s multidimensional design is the ability to pivot and nest dimensions.
For example, in sample report, an end user could very easily pivot the Region dimension with the Time dimension and obtain a complete different view by just doing drag and drop on the report.
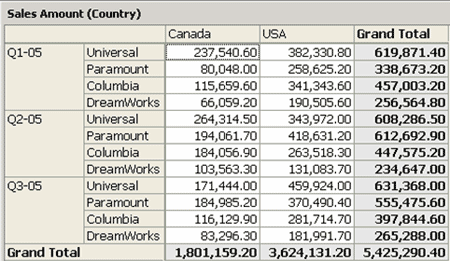
Figure 4.3
Common OLAP terms
These terms are the most commonly used in OLAP technologies.
- Cube: A multidimensional storage representation of the data. Cubes are made of cells that contain among other attributes, the data for each intersection of all dimensions.
- Dimension: A categorically consistent group of members represented as a specific axis of an OLAP cube. Typical dimensions are time, customers, products, geographic regions, distribution channels, etc.
- Hierarchy: The organizations of levels within a dimension that reflects how additive data is aggregated level by level and the top-down drill down path for users within the dimension. A typical hierarchy would be a time hierarchy made of Year – Quarter – Month – Day.
Figure 4.4 below shows the Product Category hierarchy where two members (Columbia and DreamWorks) have been selected or sliced.
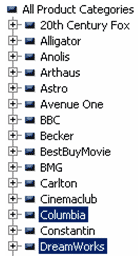
Figure 4.4
- Member: The name or label for any member at any level in a hierarchy. The bottom level members are called leaf members. In figure 4.4, Anolis, Astro and BBC are members of the dimension Product Category.
- Measure: Is any quantitative expression that you need to measure. Examples are: sales amount, sales quantity, average cost, etc. A measure is always analyzed across multiple dimensions, for example sales by quarter, by region and by product category.
Measures are either derived from the original data source (e.g.: sales) or calculated (e.g.: average selling price).
Summary
A special feature of OLAP systems is the ability to write simple formulas that automatically calculate across multiple dimensions. This ability allows OLAP analysts and administrators to perform complicated calculations typically not possible in a normal spreadsheet environment.
The gap between raw data and business information can be bridged through the processes that integrate transactional systems with Business Intelligence systems. OLAP systems enable ad hoc analysis and building reports on-the-fly that allow the end user to slice and dice their data by different dimensions and pivot these dimensions to respond to questions very quickly and visually detect trends, patterns and anomalies that would be very complex and time consuming with single-dimensional analysis.
If you need assistance or would like more information on BI, please feel free to contact us at info@axisgp.com. To view previously published articles on BI solutions please visit us at AXIS Newsletter Archive.


 Download our corporate brochure for more facts about us, our
clients and our solutions.
Download our corporate brochure for more facts about us, our
clients and our solutions.
 Driving Revenue Growth 1
 Satisfying Customers 1