In small and medium sized business, economic events are captured, recorded, and reported from their ERP systems and financial statements are generated monthly for management to discuss. The income statement is analyzed and compared to a previous period, variances are investigated, and this process is repeated throughout the year. From a 40,000 foot view, this process seems complete and appropriate, but do you have a complete picture? Managers today must replace the traditional emphasis on products and revenues with more customer-centric and profit-centric business models. They need to identify the key performance indicators (KPI) that are critical to their company’s success.
In “The Multi-Dimensional Manager”, by Richard Connelly PhD, he identifies two of these drivers that increase revenue by isolating what combinations of product mix and customer segments are driving growth. They increase gross profit (GP) by targeting prospects with the greatest profit potential. They lower selling costs as a % of sales by increasing the return on investment (ROI) on promotional dollars.
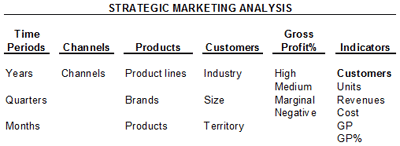
These key performance indicators capture the profitability profile of the existing customer base. The first, called strategic marketing analysis organizes customers from most profitable to least valuable, charts their lifetime value to date and captures the number of customers in each profitability tier so the trend in profitability mix can be seen easily over time. Managers in marketing can compare the profitability mix of their customers by geography, industry, volume of business by the number of different products they buy and by any number of other characteristics (color, quality, type or package size). You can view the popularity of a color over all plastic products or kitchenware, material type, or combination of both. You can also untangle a complex hierarchy into independent dimensions such as product line, finishing and handle type. You can even map these attributes by customer, channel, and organizational responsibility.


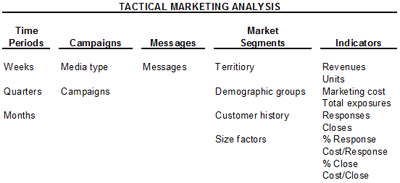
The second key performance indicator is the tactical marketing analysis. It evaluates the effectiveness of marketing campaigns. You can use it to do a cost per close which is more powerful than cost per response and percentage response. You can compare the cost per response between advertising, direct mail, and trade shows. Lastly, you can compare the profile of response against the ideal profile of high profit customers – the right customer for the future. By calculating the profitability equation, the company can now link its investments in customer relationships specifically to the returns those customers generate.

If you are interested in more information, please contact us at info@axisgp.com.


 Download our corporate brochure for more facts about us, our
clients and our solutions.
 Driving Revenue Growth 1
 Satisfying Customers 1